STR Revenue Benchmarks by Market: What 70%+ Occupancy Actually Returns
Most STR owners chase occupancy targets without knowing what they translate to in net dollars. This post models actual returns at 70%, 75%, and 80% occupancy across five major markets.
Selly Marketing & Promotions
Aug 15, 2026 · 9 min read
STR Revenue Benchmarks by Market: What 70%+ Occupancy Actually Returns
Most short-term rental owners set an occupancy target without knowing what that number actually means for their bottom line. Hitting 75% sounds like progress — but in Nashville it models out very differently than in coastal Florida. This post breaks down net return projections at 70%, 75%, and 80% occupancy across five active STR markets so you can evaluate performance against something real.
Why Occupancy Rate Is the Wrong Starting Point
Occupancy rate matters, but it does not tell you what a property earns. Two properties can both hit 72% occupancy while one generates $58,000 in annual gross revenue and the other generates $94,000. The gap is almost always ADR — average daily rate — and how intelligently it moves with demand.
The metric that ties both together is RevPAN: revenue per available night. It multiplies your ADR by your occupancy rate and gives you the actual yield per night your asset is generating across the entire calendar. According to AirDNA's short-term rental metrics framework, RevPAN is the single most reliable indicator of whether a listing is outperforming or underperforming its market.
The benchmarks below use RevPAN as the anchor, layered with realistic operating cost assumptions, to model what investors can actually expect to net at each occupancy tier.
How These Projections Are Built
Each market model assumes a two-bedroom, well-furnished STR listed on Airbnb, VRBO, and a direct-book channel. Operating cost structure is standardized across markets at the following assumptions:
Management fee: 20% of gross revenue
Cleaning and turnover: Passed through at cost (estimated at $90–$140 per turn, averaging 4.5 turns per month)
Supplies and restocking: $150–$200/month
Platform fees: Absorbed in gross revenue net of host service fee (typically 3%)
Insurance (STR rider): $150–$250/month
Utilities: $200–$350/month depending on market
Minor maintenance reserve: 3% of gross revenue annually
These are conservative assumptions. Properties operating on a thinner cost structure — owner-managed, lower cleaning rates — will net higher. Properties with higher mortgage debt service or premium furnishing depreciation will net lower.
Nashville, TN: Music City's STR Floor Is Higher Than Most Markets
Nashville remains one of the most resilient STR markets in the country. Bachelorette and bachelor travel, concert demand, and a year-round event calendar keep occupancy from falling off a cliff in shoulder months.
Market ADR range (2-bedroom): $185–$260/night
| Occupancy Tier | Annual Occupied Nights | Gross Revenue (mid ADR: $220) | Est. Net (after ops) |
The spread between a 70% and 80% occupancy property in Nashville is not usually driven by demand — it is driven by listing quality and pricing discipline. Nashville has enough inbound volume that an under-optimized listing still fills. The operators clearing $42,000+ net are the ones running dynamic pricing tuned to the stadium and convention calendar, not a static weekend/weekday split.
Scottsdale, AZ: Peak Season Skew Creates a High-Variance Market
Scottsdale's STR performance is heavily front-loaded. January through April is one of the highest-ADR windows in the country for short-term rentals. Summer compresses hard — ADR can drop 35–45% from peak — which means annual occupancy figures and annual gross revenue require careful seasonal modeling.
Market ADR range (2-bedroom): $195–$340/night (peak); $110–$160/night (summer)
Blended annual ADR estimate: $210–$245/night
| Occupancy Tier | Annual Occupied Nights | Gross Revenue (mid blended ADR: $225) | Est. Net (after ops) |
Scottsdale's high-performing operators do two things differently: they protect peak-season ADR aggressively (no discounting in February–March to fill nights that would have filled anyway), and they run targeted paid media in the summer to smooth the trough. AirDNA's occupancy valuation methodology consistently shows Scottsdale properties where seasonal pricing is mismanaged leaving $8,000–$14,000/year on the table relative to market peers.
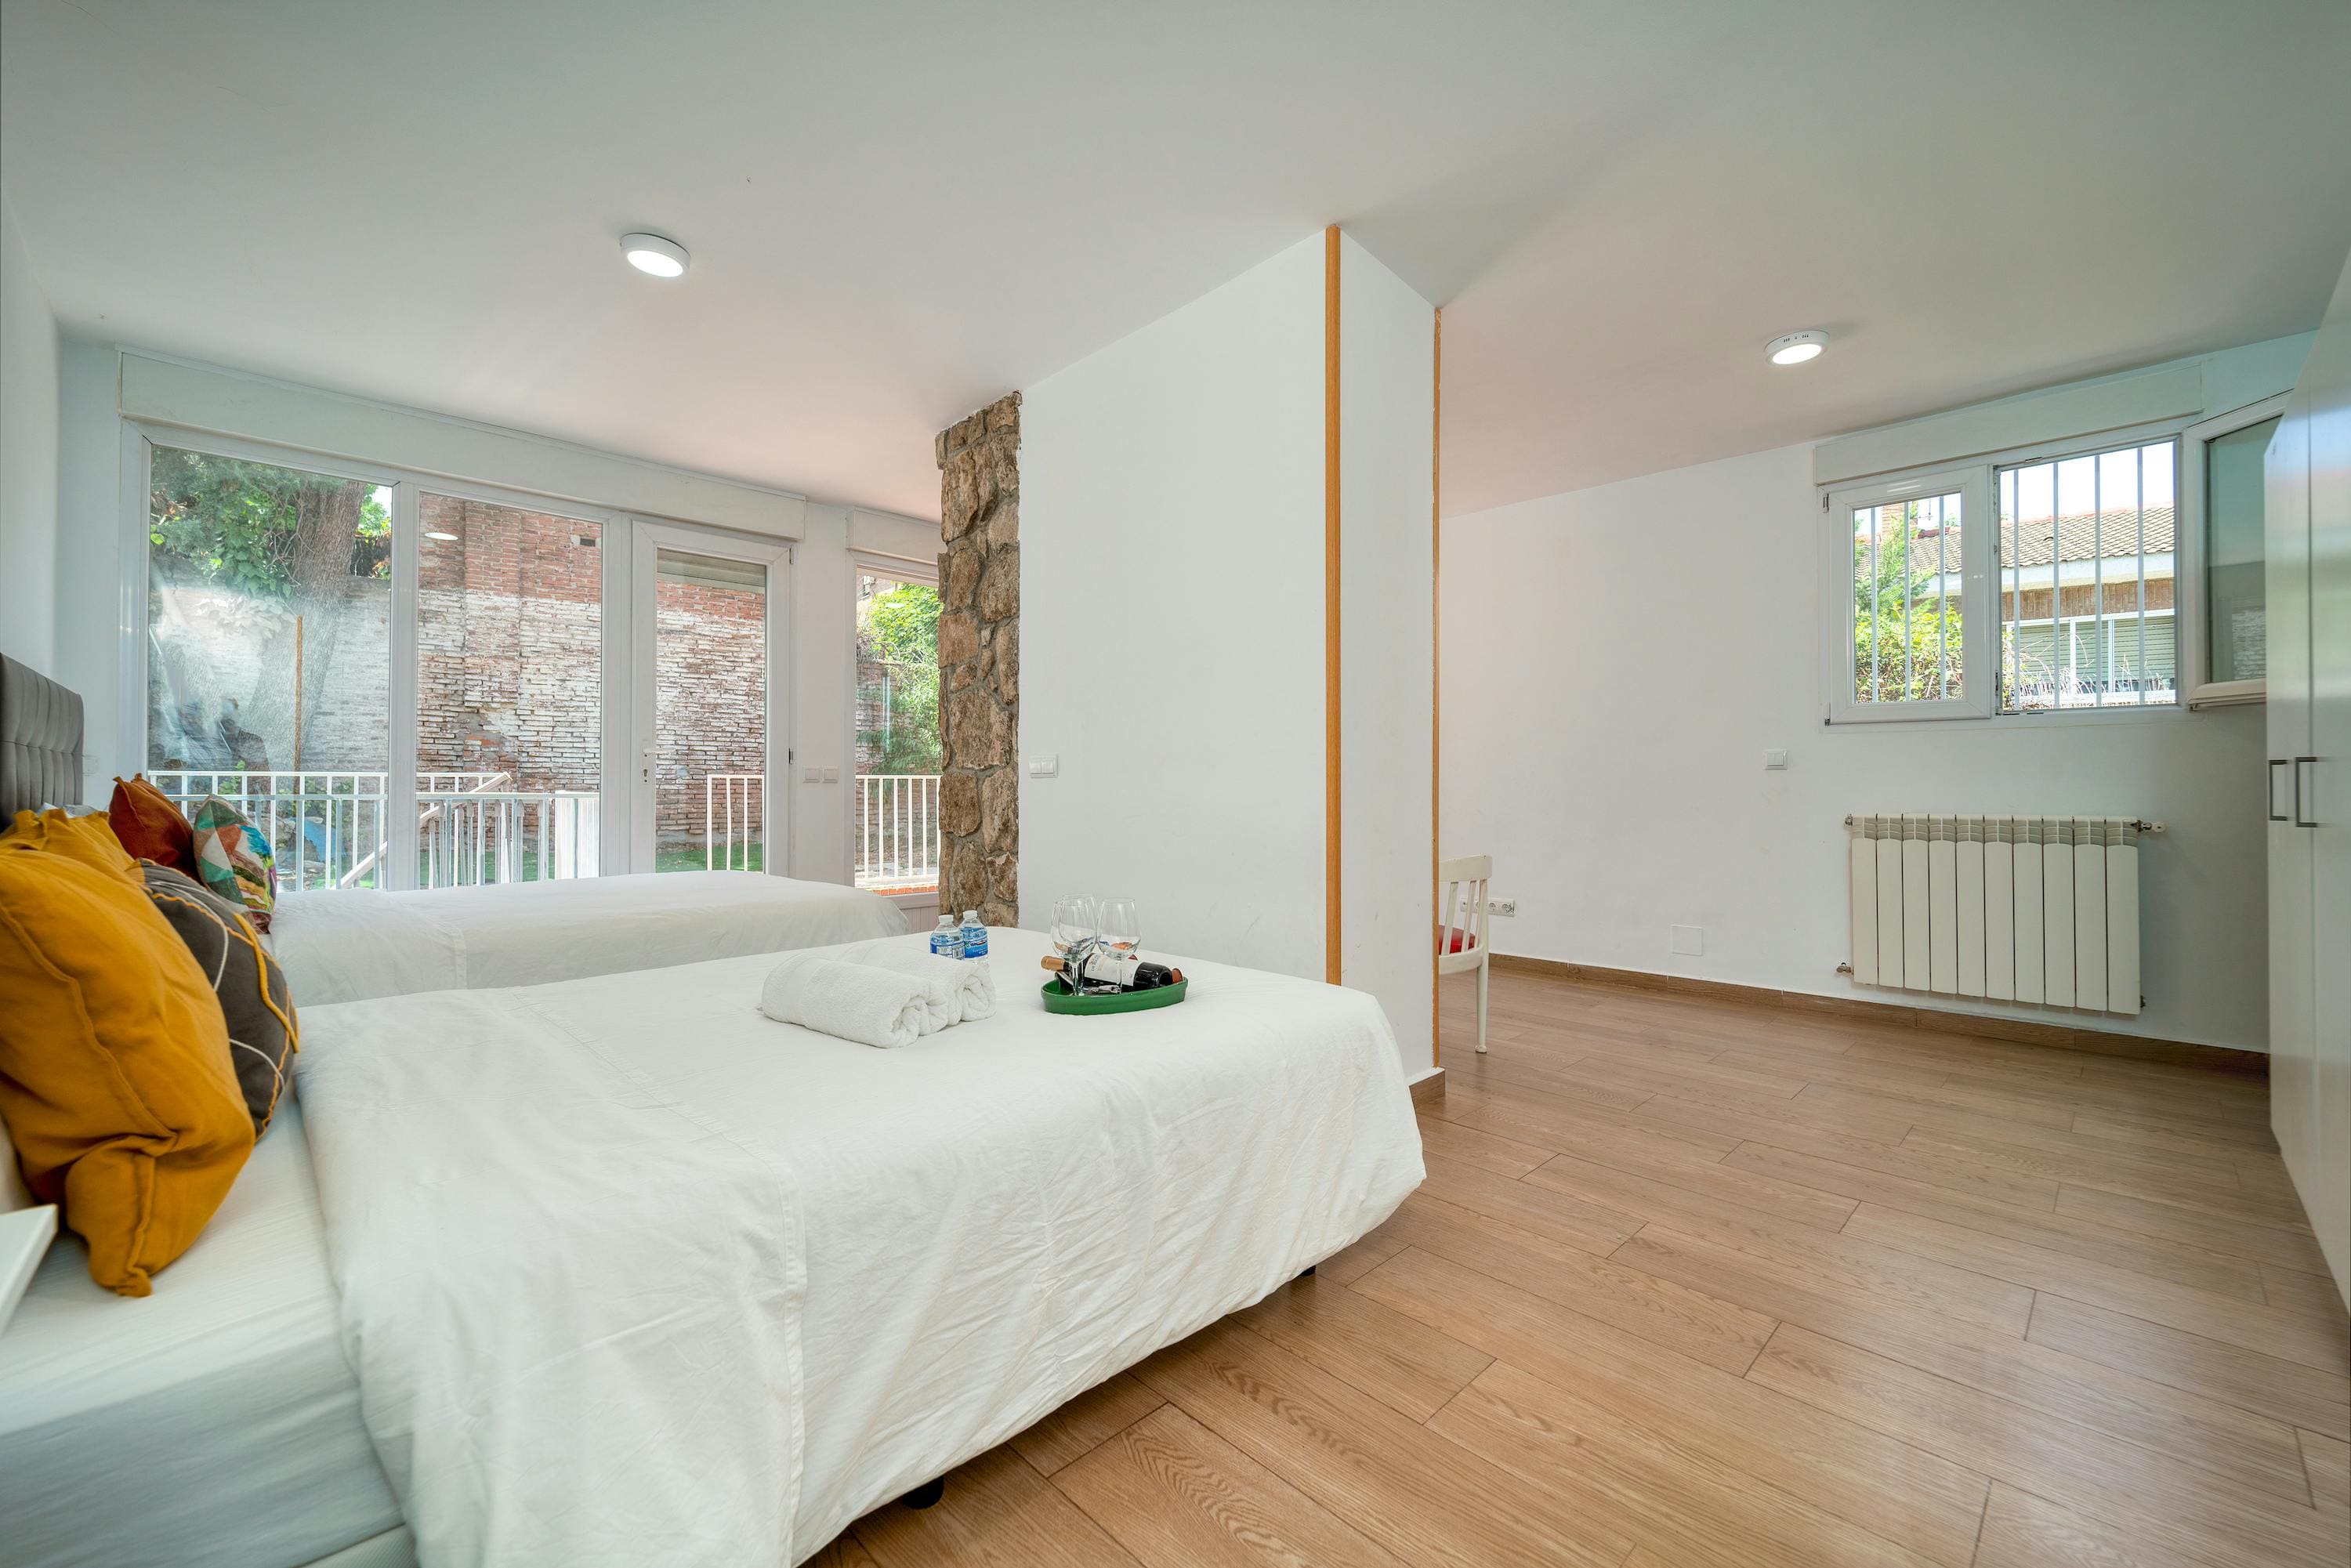
Bright STR twin bedroom with garden door view
Savannah, GA: Underpriced Inventory in a High-Demand Corridor
Savannah is one of the most interesting STR markets for investors right now. It has a dense historic district that drives consistent leisure travel, a growing meetings and events calendar, and a supply base that is still predominantly composed of independently managed properties — many of them underoptimized.
Market ADR range (2-bedroom): $155–$220/night
| Occupancy Tier | Annual Occupied Nights | Gross Revenue (mid ADR: $185) | Est. Net (after ops) |
Savannah's ceiling is lower than Nashville or Scottsdale in absolute dollars, but its cost basis is also lower. A well-positioned two-bedroom in Savannah's historic core can be acquired at a purchase price that makes the $33,000–$38,000 net range highly competitive on a cap rate basis. The operators beating market RevPAN in Savannah are the ones who have invested in professional photography and copywriting — the listing quality gap in this market is significant, which means the upside from optimization is larger than in more competitive markets.
For a closer look at how listing quality and pricing strategy compound into measurable revenue differences, the post on why most Airbnb listings fail in the first 90 days covers the mechanics in detail.
Denver, CO: Regulatory Headwinds Compress Supply, Which Helps Compliant Operators
Denver has tightened its STR licensing requirements significantly. Operators must hold a valid STR license tied to a primary residence or approved property, which has removed a meaningful portion of speculative inventory from the market. The result: compliant operators are seeing stronger occupancy because supply has contracted.
Market ADR range (2-bedroom): $165–$240/night
| Occupancy Tier | Annual Occupied Nights | Gross Revenue (mid ADR: $195) | Est. Net (after ops) |
Compliance is the baseline cost of doing business in Denver. Operators who are licensed and operating within the regulatory framework are competing in a smaller, cleaner supply pool — which is a structural advantage that did not exist three years ago. The post on short-term rental regulations by state covers the Denver framework alongside other regulated markets if you are evaluating compliance exposure across a portfolio.
For a broader view on where STR investment fundamentals are strongest heading into 2026, AirDNA's best places to invest in short-term rentals provides market-by-market scoring based on RevPAN trajectory, supply growth, and regulatory environment.
Coastal Florida: The Highest Ceiling, the Most Variance
Coastal Florida — spanning markets from Panama City Beach and 30A through Naples and the Space Coast — is not one market. It is a collection of micro-markets with dramatically different ADR profiles, seasonal windows, and renter demographics. The figures below use a composite of mid-tier coastal markets (not Miami Beach or the most premium 30A inventory, which skews higher).
Market ADR range (2-bedroom, coastal composite): $195–$310/night
Blended annual ADR estimate: $230–$260/night
| Occupancy Tier | Annual Occupied Nights | Gross Revenue (mid blended ADR: $245) | Est. Net (after ops) |
Coastal Florida is the only market in this analysis where the 80% tier reliably clears $50,000 net for a two-bedroom at mid-market ADR. The operators reaching that tier are doing three things: running multi-platform distribution with an active direct-book channel to reduce platform fee drag, maintaining review averages above 4.85 (which directly affects search ranking and booking velocity), and deploying paid media during the shoulder window between summer peak and snowbird season.
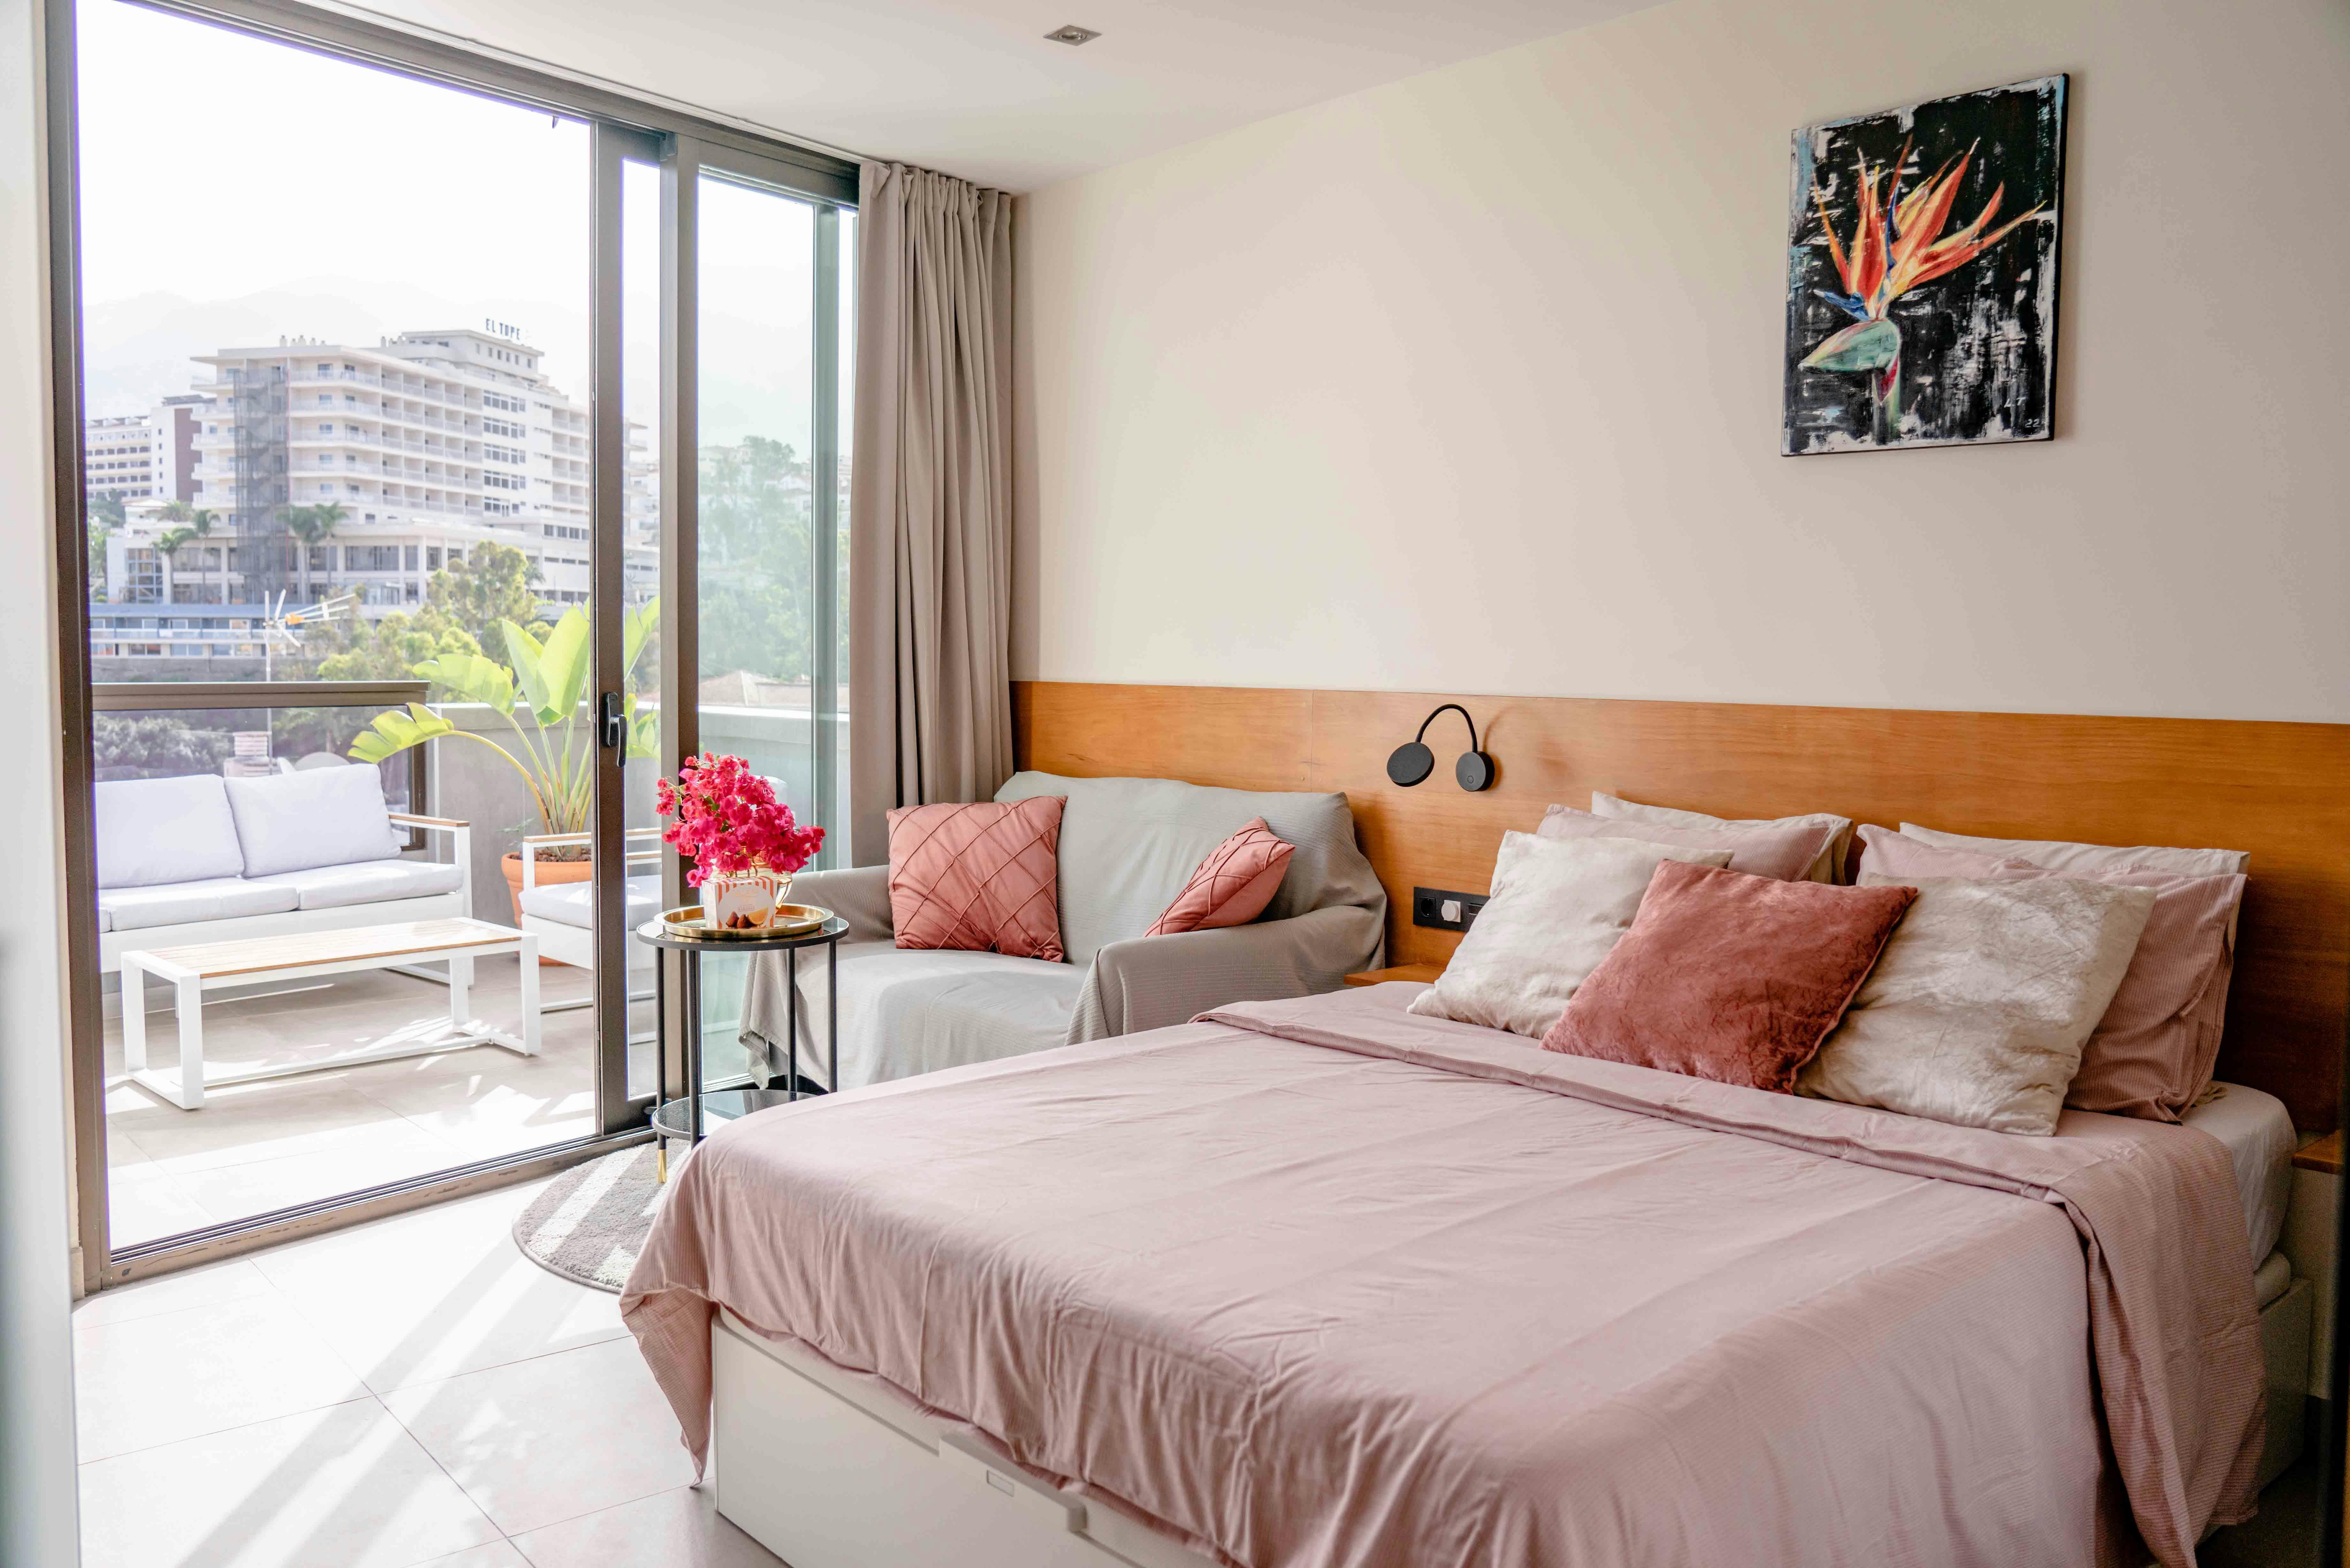
Luxury STR bedroom with balcony and resort surroundings
For investors evaluating Airbnb yield — the relationship between purchase price, gross revenue, and net return — AirDNA's Airbnb yield framework is a useful reference for building acquisition-stage underwriting before you commit to a market.
What These Numbers Mean for Your Portfolio Decision
Across all five markets, the difference between a 70% and 80% occupancy property is not simply a function of demand — it is almost always a function of operations. The 10-point occupancy gap between a well-run and a poorly-run listing in the same submarket typically represents $8,000–$14,000 in annual gross revenue, depending on ADR. At a 20% management fee structure, that gap is $6,400–$11,200 in additional net income per property per year.
At a portfolio level, the compounding effect is significant. An owner with five properties in a mid-tier coastal Florida market running at 72% average occupancy vs. 80% is leaving roughly $40,000–$56,000 in annual net income on the table — not because of a bad market, but because of an underperforming operational system.
Selly's full-service Airbnb property management is built specifically to close that gap. The 10-operation management model — covering everything from dynamic pricing to paid media — is designed to move properties from market-average occupancy to market-leading performance on a consistent basis.
Most STR properties need at least 60–65% occupancy to cover fixed costs at typical ADR levels. Meaningful cash flow — net positive after all operating expenses — generally requires 70%+ occupancy in most markets, with the target varying by purchase price, debt service, and local ADR.
Yes. RevPAN — revenue per available night — combines ADR and occupancy into a single yield metric, making it the most accurate way to compare performance across properties or markets. A property with 80% occupancy at a $150 ADR ($120 RevPAN) underperforms one running 70% at a $220 ADR ($154 RevPAN).
The difference is ADR. Coastal Florida commands higher nightly rates driven by beach access, seasonal scarcity, and leisure travel demand. At the same 75% occupancy level, a higher ADR market will always generate more gross revenue — and more net income after a fixed-percentage management fee structure.
These are market-composite models built on mid-tier two-bedroom assumptions. Actual performance depends on property-specific factors including exact location, listing quality, furnished condition, review history, pricing strategy, and platform distribution. A property-specific revenue projection requires a direct audit against local comp data.
For most owners, yes — particularly those who are self-managing. The management fee is typically offset by the revenue gain from professional pricing, listing optimization, and operational consistency. Selly's managed portfolio averaged 78.4% STR occupancy in 2025, which benchmarks above most self-managed properties in the same markets.
The Math Determines the Market. The Operations Determine the Outcome.
Occupancy benchmarks are useful for setting expectations — but they are not predictive on their own. The same market, the same occupancy rate, and the same ADR range will produce dramatically different net returns depending on how the property is managed. The operators clearing the top of each range in Nashville, Scottsdale, Savannah, Denver, and coastal Florida are not operating in fundamentally different markets. They are operating with fundamentally better systems.
Selly's Airbnb property management platform applies institutional-grade operations to properties of every size — from single-unit owners to 20-property portfolios. If your current occupancy or net return is not matching the benchmarks above, the gap is almost always operational.